Screen by screen
What bank apps look like inside
288 images from 16 bank apps, grouped by task so you can compare how each one handles the same job. Every image shows where we found it, with the date.
App Store, Google Play and bank website images are the banks' own marketing, so names and balances are sample data. Help center images come from each bank's support pages; Bank of America's mark where to tap with green circles. Where screens come from.
Investments

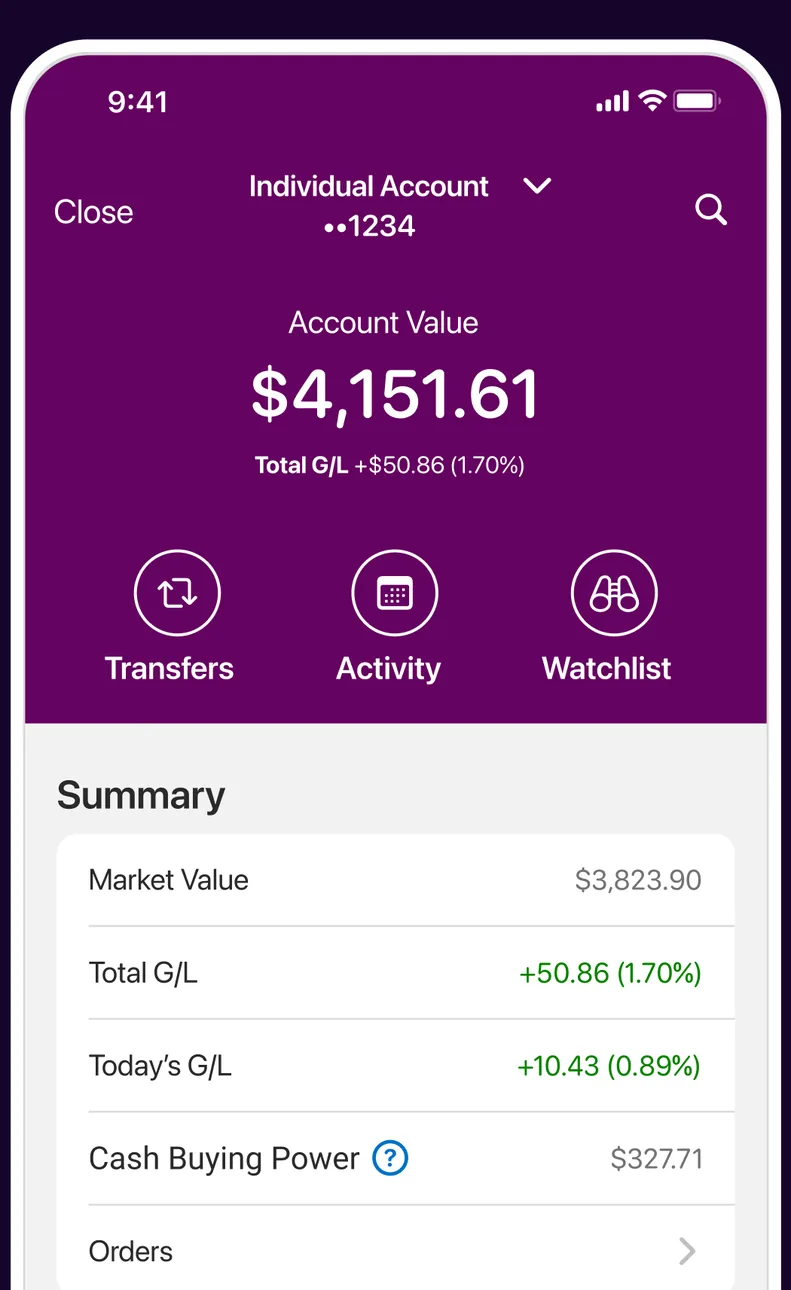
App Store marketing imageAn Individual Account screen showing a $4,151.61 account value with Transfers, Activity and Watchlist buttons and a Summary of market value and gains.App Store listing, as of 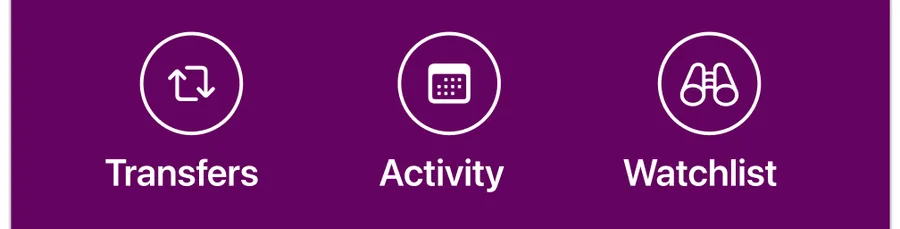
App Store marketing imageTransfers, Activity and Watchlist buttons on a purple header.App Store listing, as of 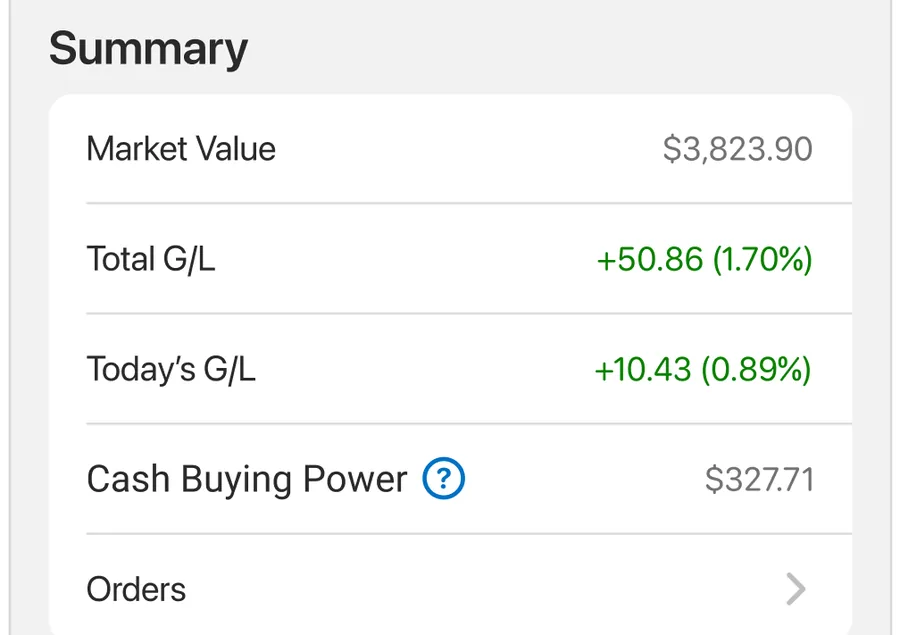
App Store marketing imageA Summary list with market value, total gain or loss, today's gain or loss, cash buying power and orders.App Store listing, as of
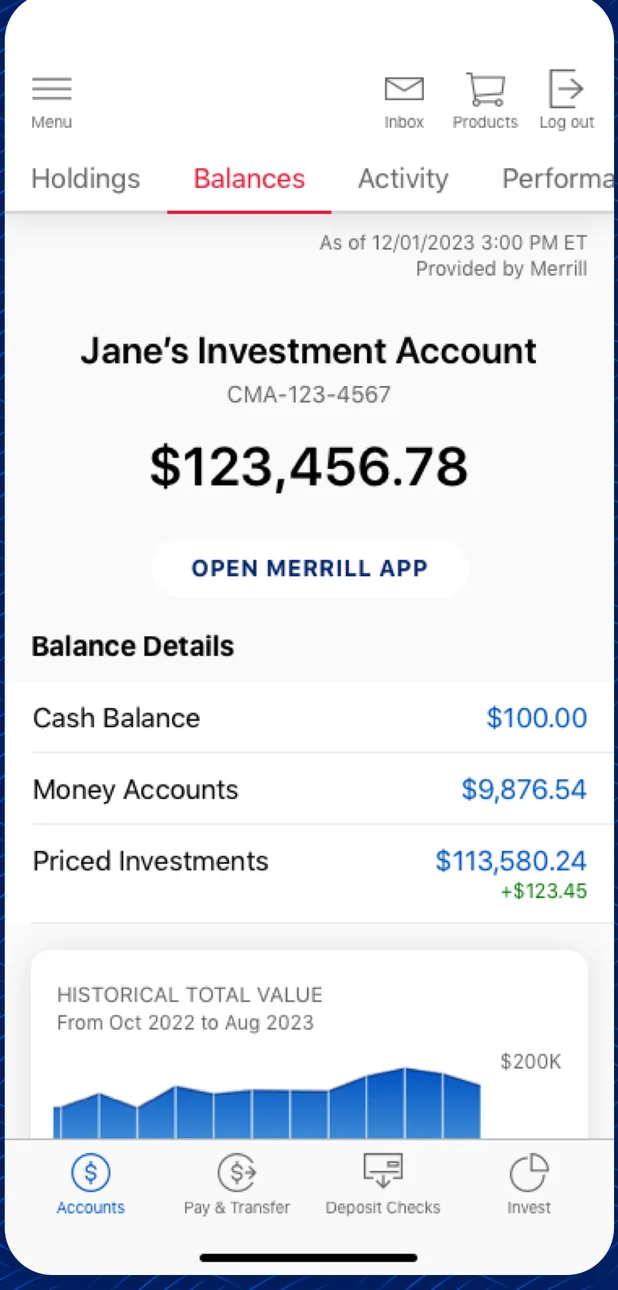
App Store marketing imageA Merrill investment account screen showing a balance of $123,456.78, balance details and a historical value chart.App Store listing, as of 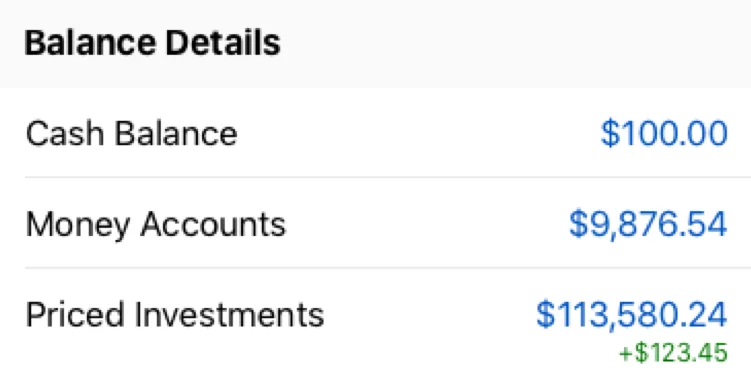
App Store marketing imageA Balance Details list with cash balance, money accounts and priced investments.App Store listing, as of

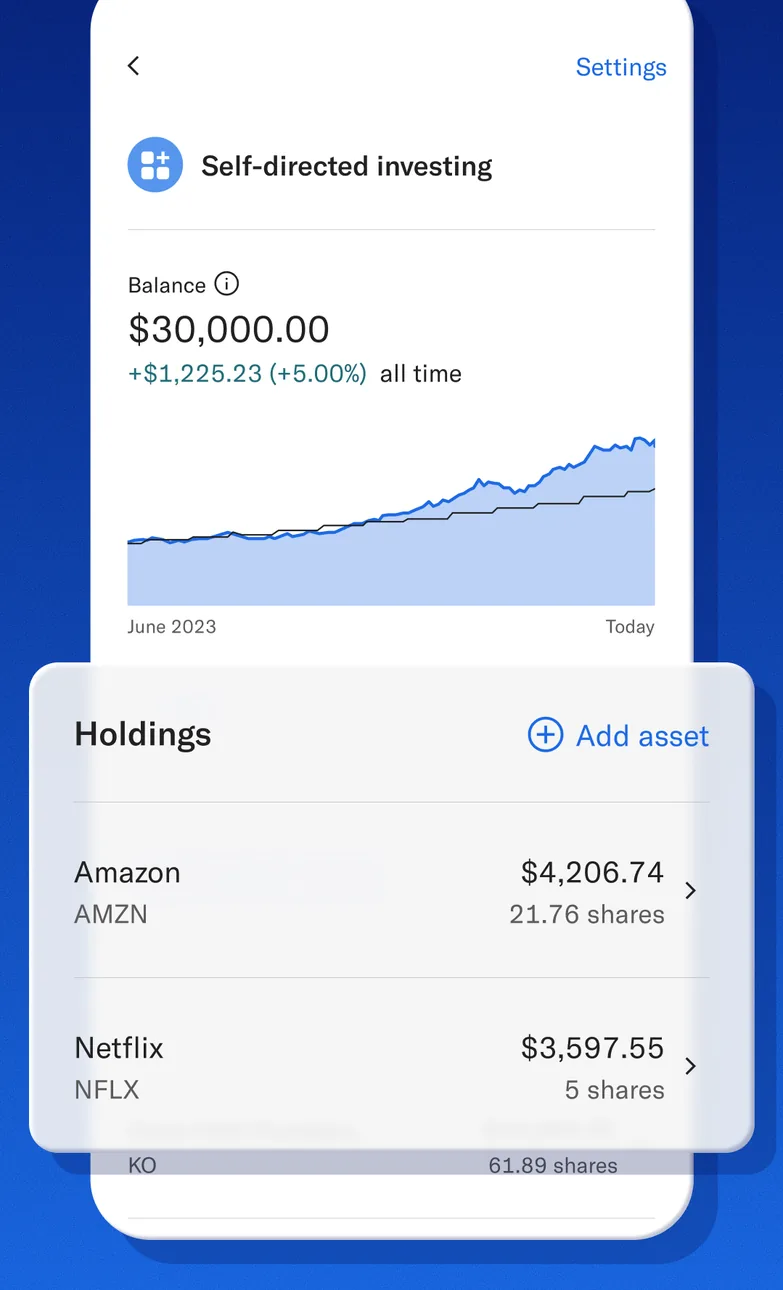
App Store marketing imageA Self-directed investing screen showing a $30,000.00 balance with a performance chart and a Holdings list with Amazon and Netflix.App Store listing, as of 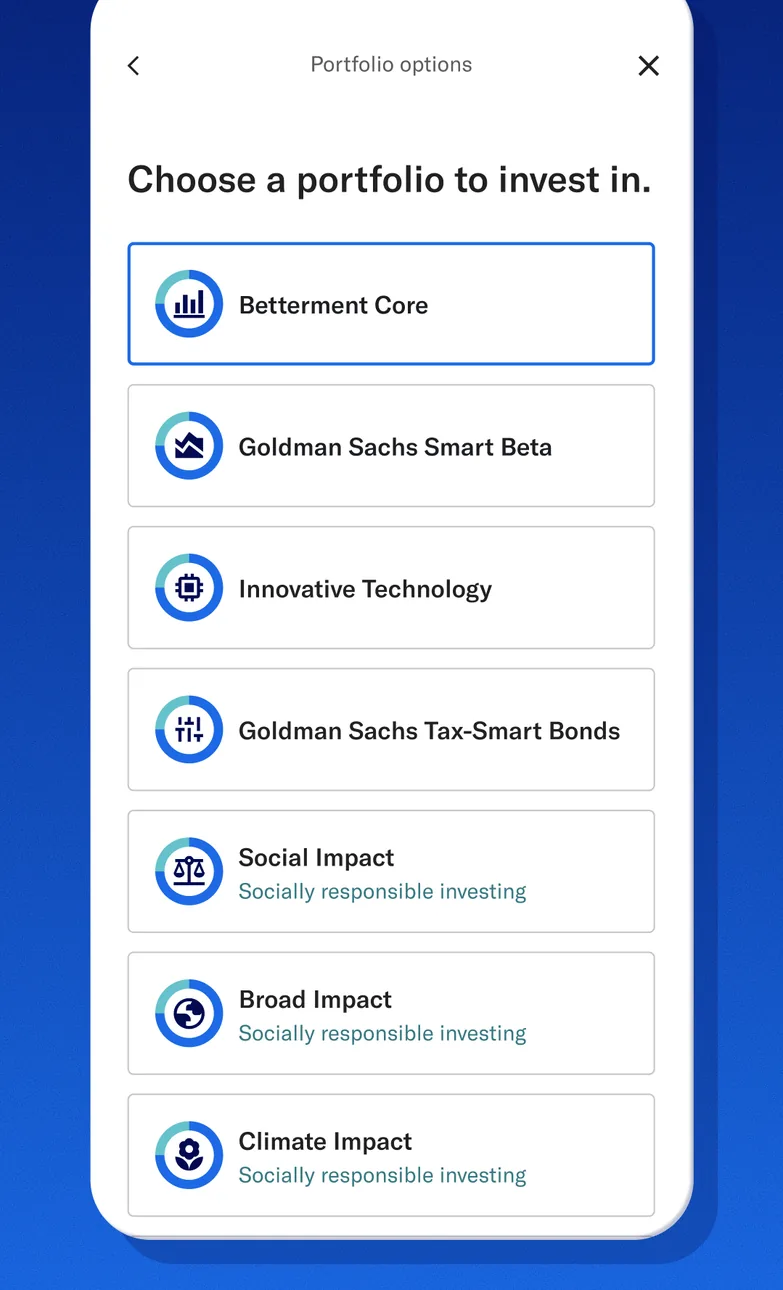
App Store marketing imageA Portfolio options screen asking Choose a portfolio to invest in, listing options such as Betterment Core, Goldman Sachs Smart Beta, Innovative Technology and Climate Impact.App Store listing, as of 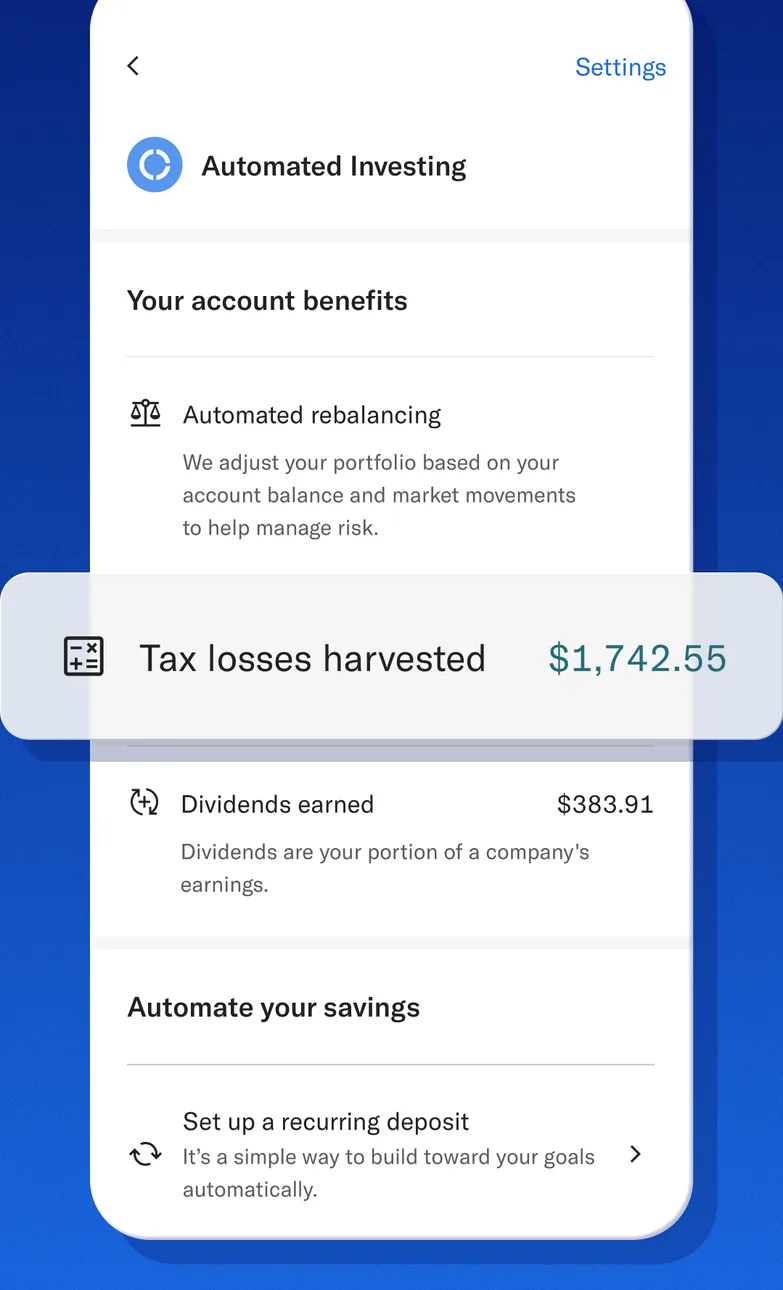
App Store marketing imageAn Automated investing screen listing account benefits including tax losses harvested of $1,742.55 and dividends earned, with an Automate your savings section.App Store listing, as of 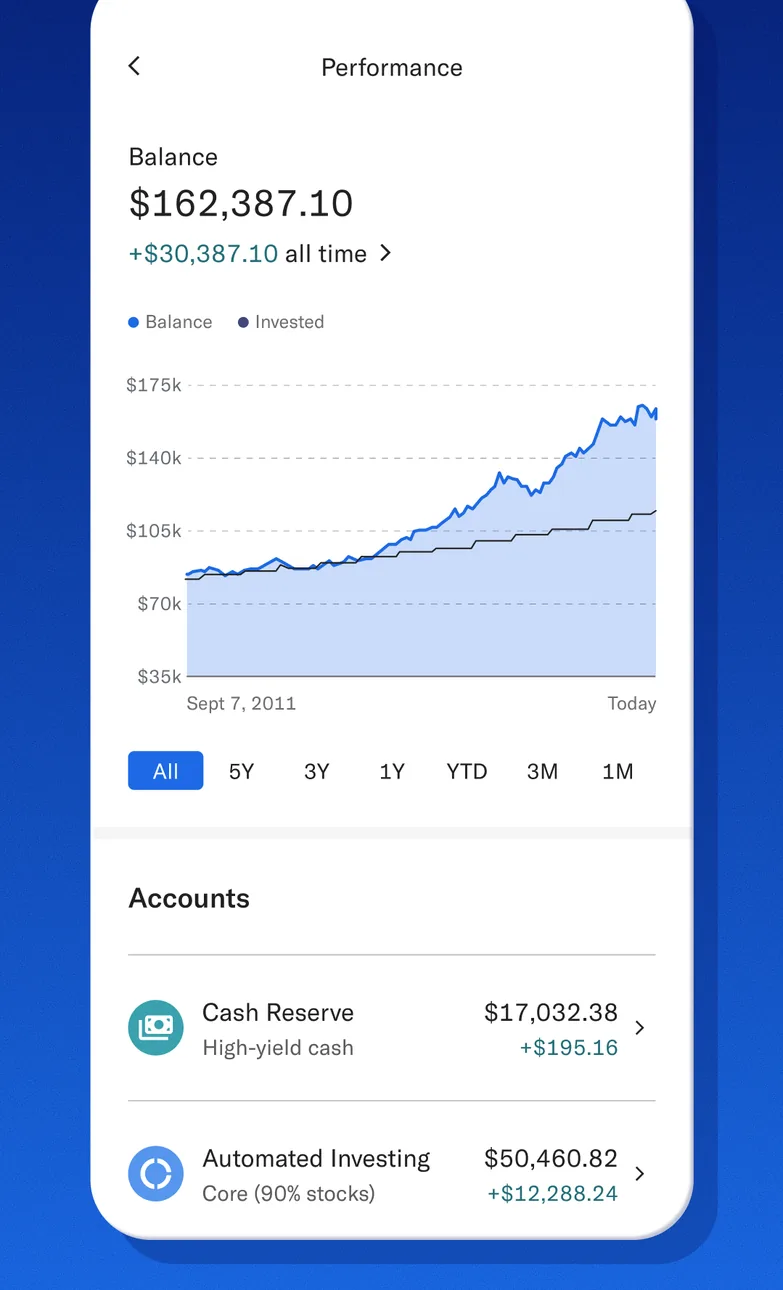
App Store marketing imageA Performance screen showing a $162,387.10 balance with a growth chart, time range buttons and an Accounts list.App Store listing, as of 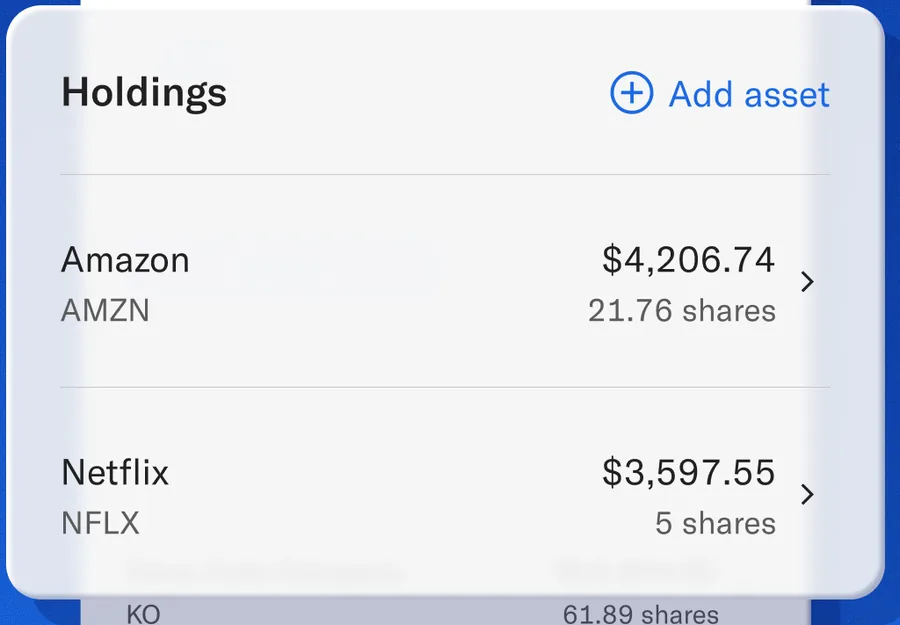
App Store marketing imageA Holdings card with Amazon at $4,206.74 and Netflix at $3,597.55 and an Add asset link.App Store listing, as of 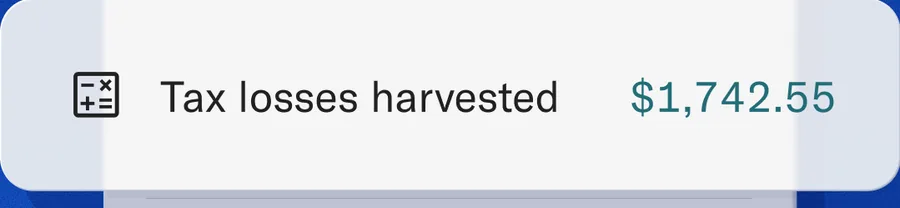
App Store marketing imageA callout showing $1,742.55 in tax losses harvested.App Store listing, as of 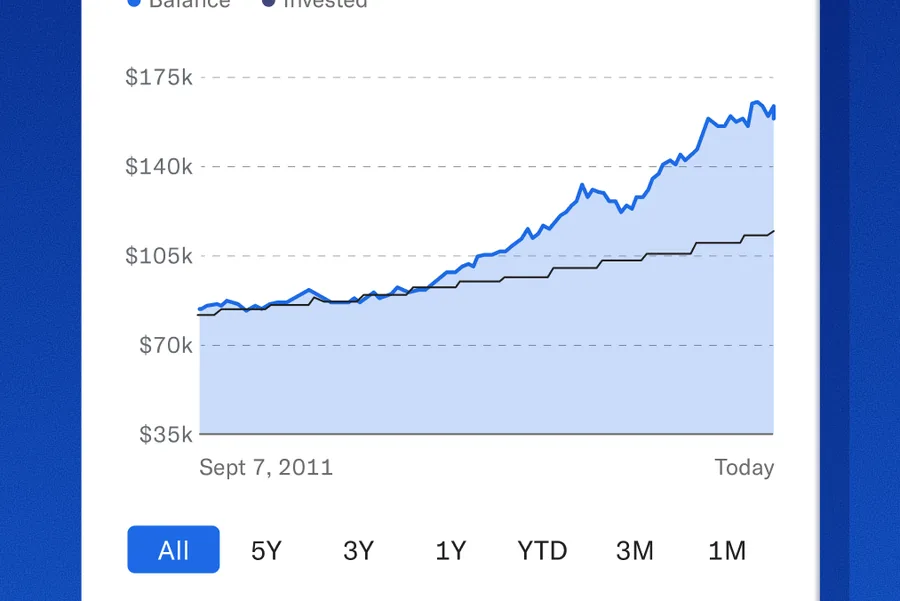
App Store marketing imageA balance and invested line chart from 2011 to today with time range buttons.App Store listing, as of 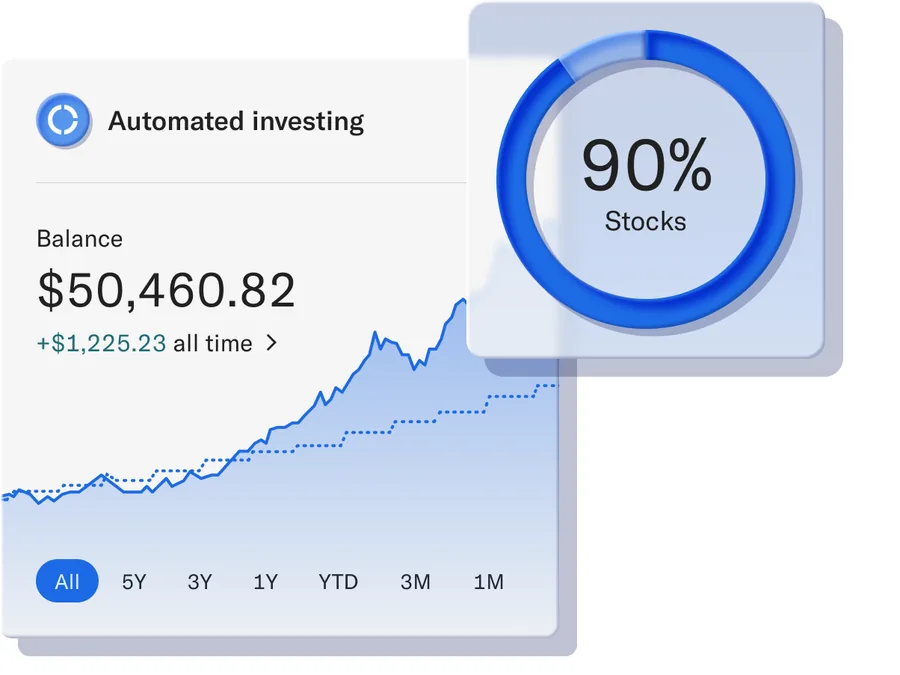
From Betterment's websiteAn Automated investing card with a $50,460.82 balance, a 90% stocks ring, a growth chart and time range buttons.betterment.com, as of 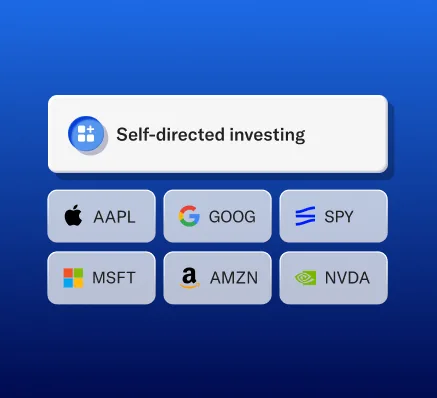
From Betterment's websiteA Self-directed investing header above tiles for AAPL, GOOG, SPY, MSFT, AMZN and NVDA.betterment.com, as of 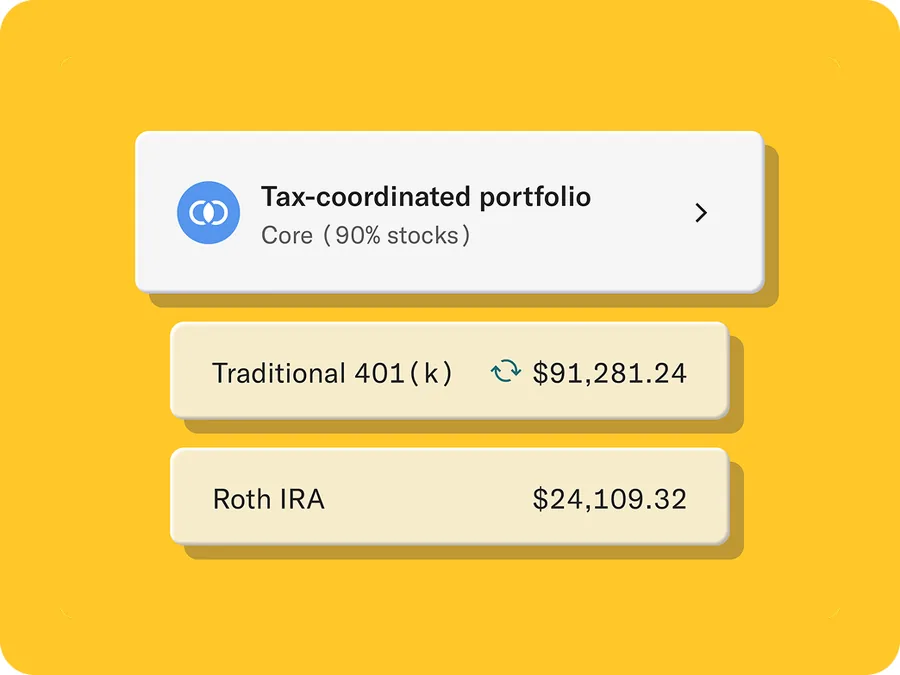
From Betterment's websiteA Tax-coordinated portfolio row above Traditional 401(k) at $91,281.24 and Roth IRA at $24,109.32.betterment.com, as of
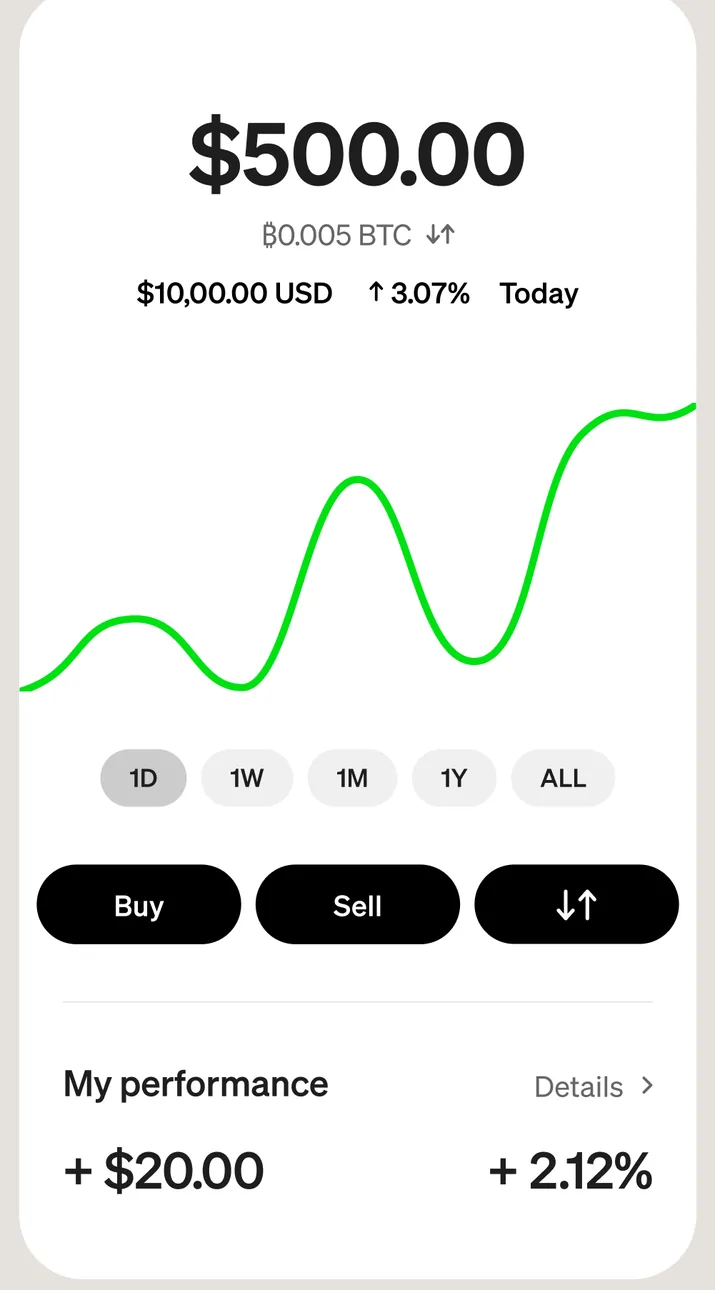
App Store marketing imageA bitcoin screen showing $500.00 with a price chart, time range buttons, Buy, Sell and send buttons, and My performance of +$20.00 and +2.12%.App Store listing, as of 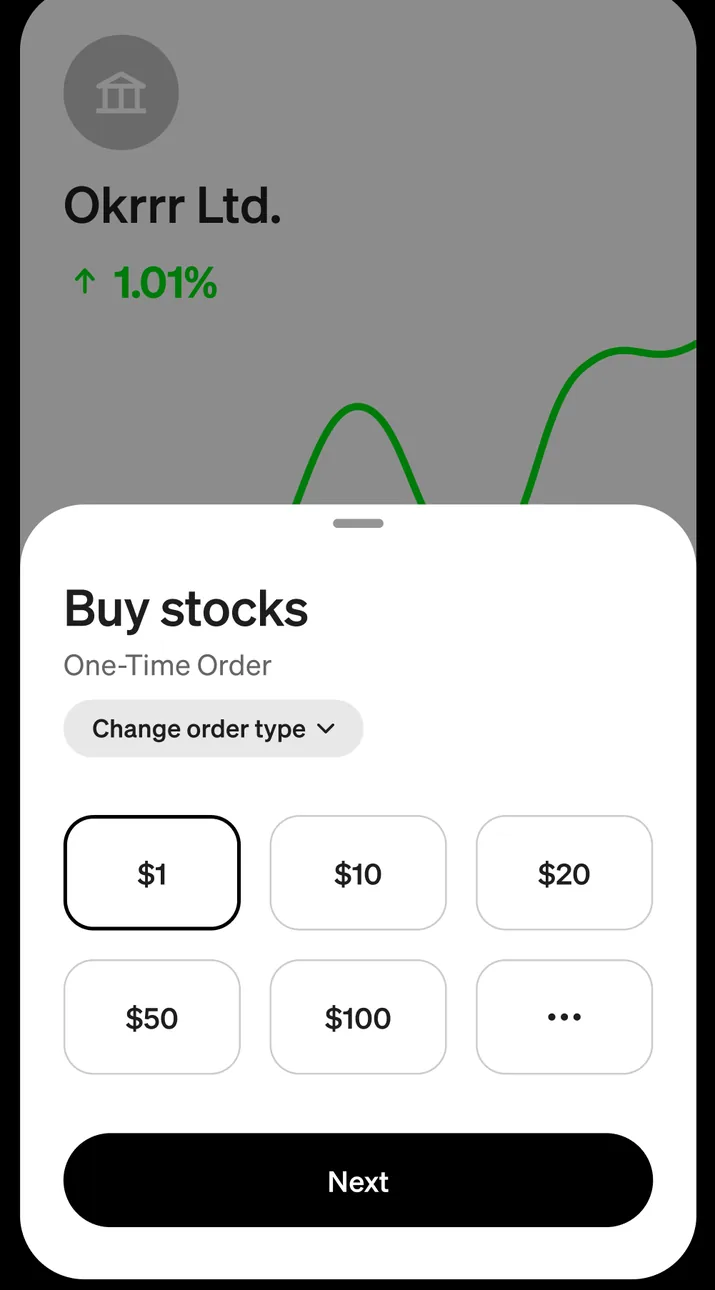
App Store marketing imageA Buy stocks sheet over a stock chart with a one-time order, amount options of $1, $10, $20, $50 and $100, and a Next button.App Store listing, as of 
App Store marketing imageBuy, Sell and transfer buttons below a bitcoin chart.App Store listing, as of 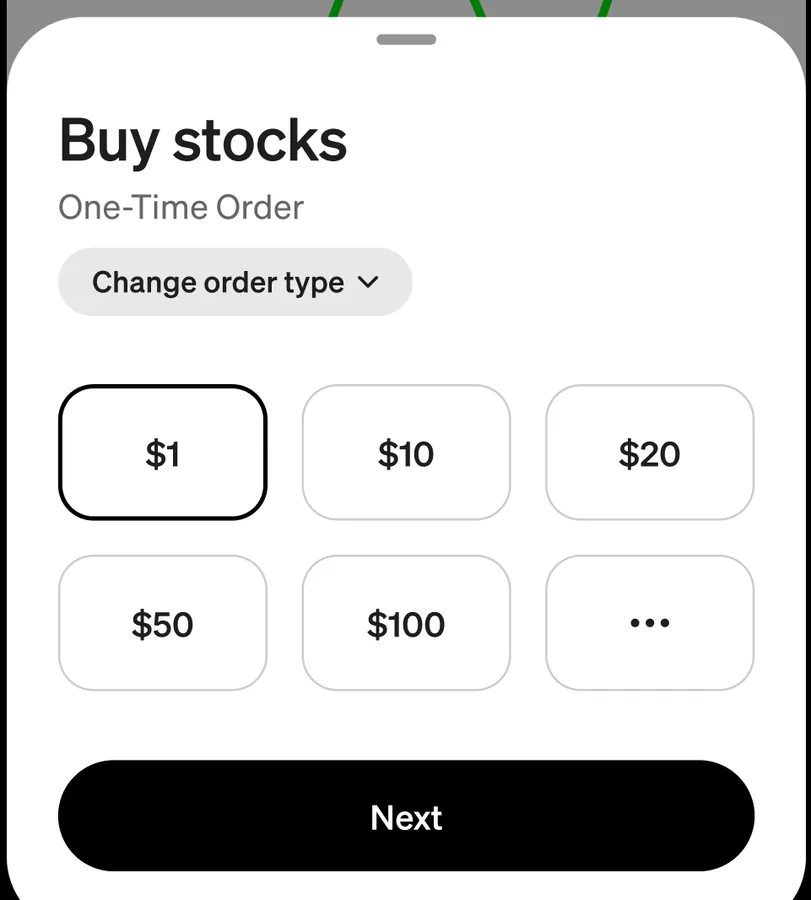
App Store marketing imageA Buy stocks sheet with dollar amount buttons from $1 to $100 and a Next button.App Store listing, as of

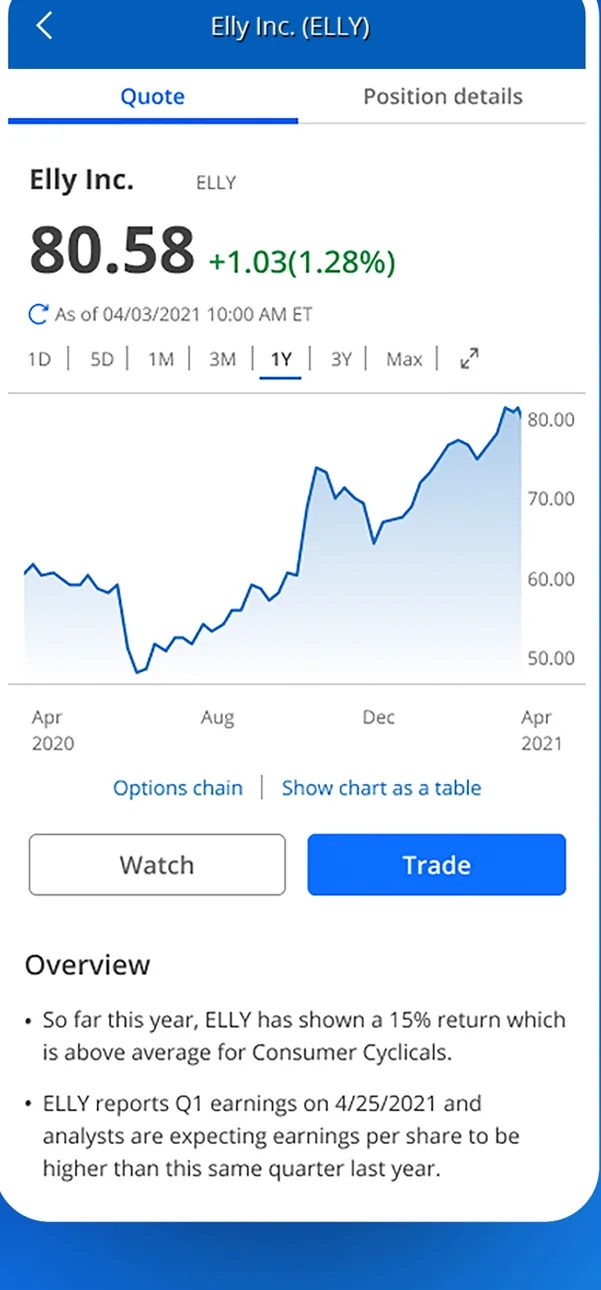
App Store marketing imageA stock quote screen for Elly Inc. showing an 80.58 share price, a one year price chart, and Watch and Trade buttons.App Store listing, as of 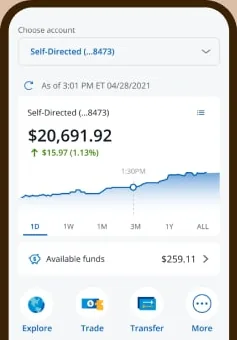
From Chase's websiteA self-directed investing account showing $20,691.92 with a one day chart, available funds of $259.11, and Explore, Trade, Transfer and More buttons.chase.com, as of 
App Store marketing imageWatch and Trade buttons below a stock chart.App Store listing, as of

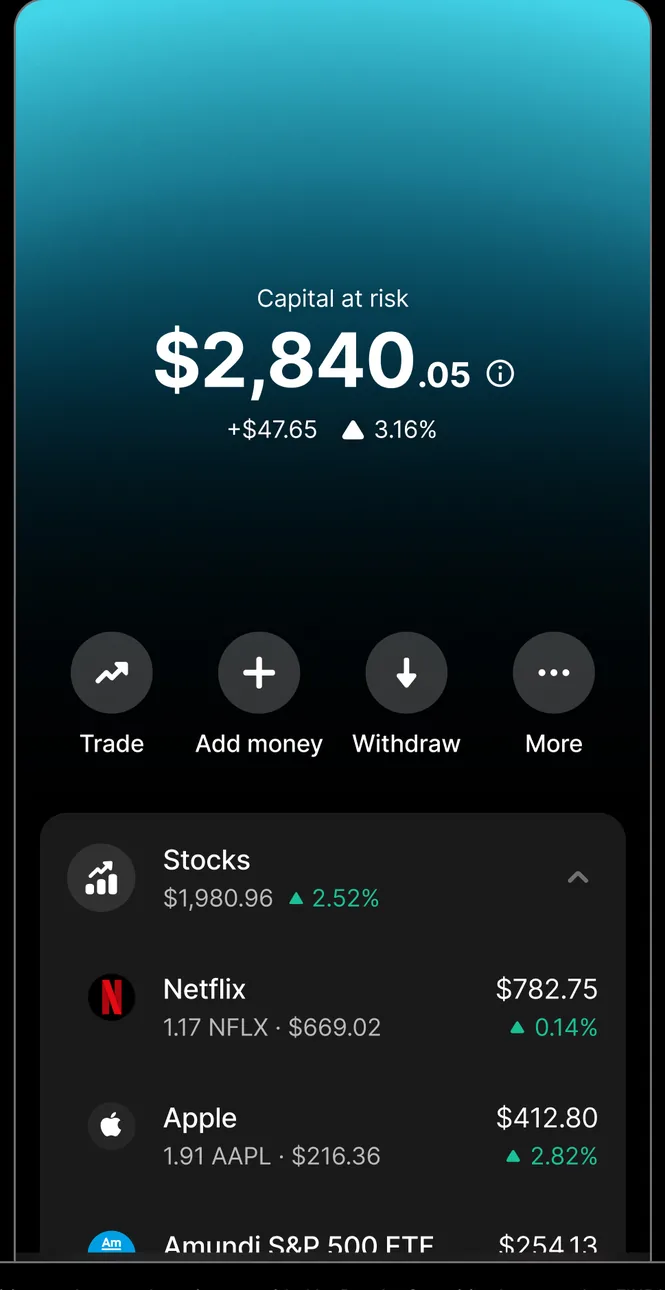
App Store marketing imageAn investing screen showing $2,840.05 at risk with Trade, Add money, Withdraw and More buttons and a Stocks list with Netflix and Apple.App Store listing, as of 
App Store marketing imageRound buttons for Trade, Add money, Withdraw and More.App Store listing, as of

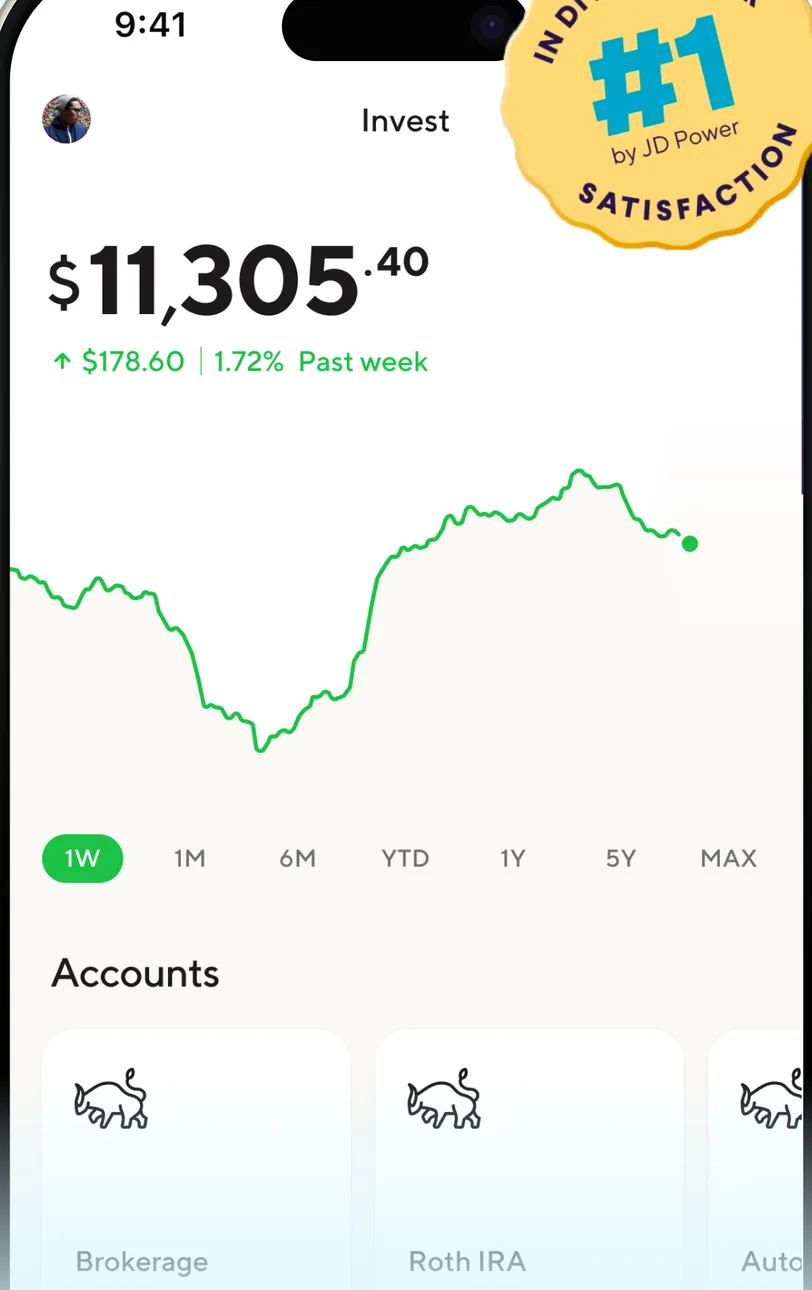
App Store marketing imageAn Invest screen showing $11,305.40 with a one week performance chart, time range buttons and an Accounts section.App Store listing, as of 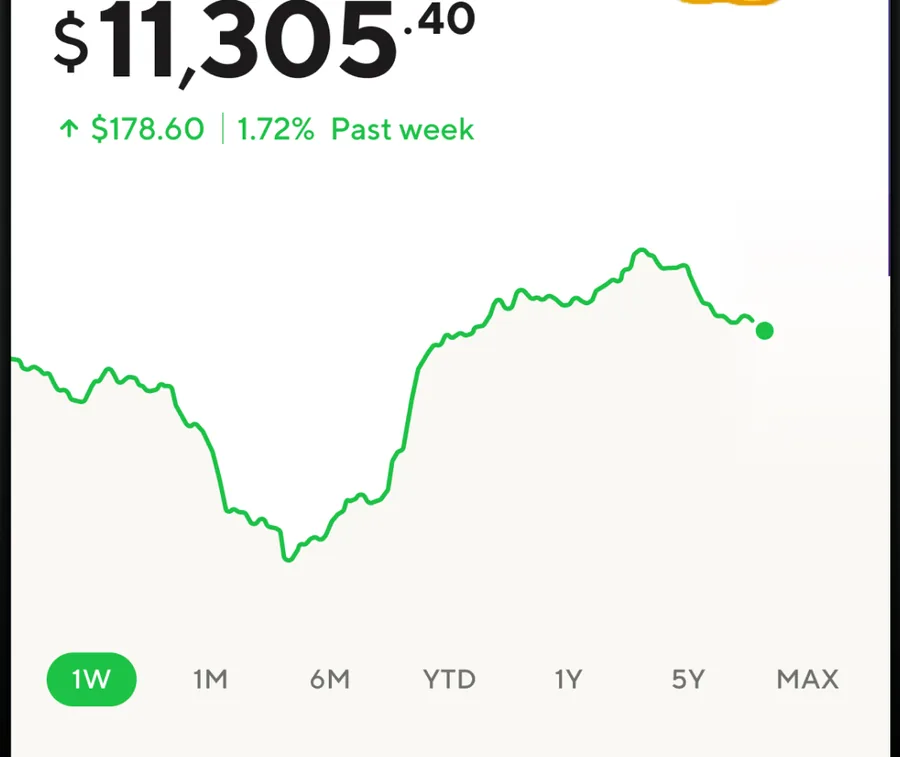
App Store marketing imageA portfolio value of $11,305.40, up $178.60 in the past week, above a one week line chart and time range buttons from 1W to MAX.App Store listing, as of

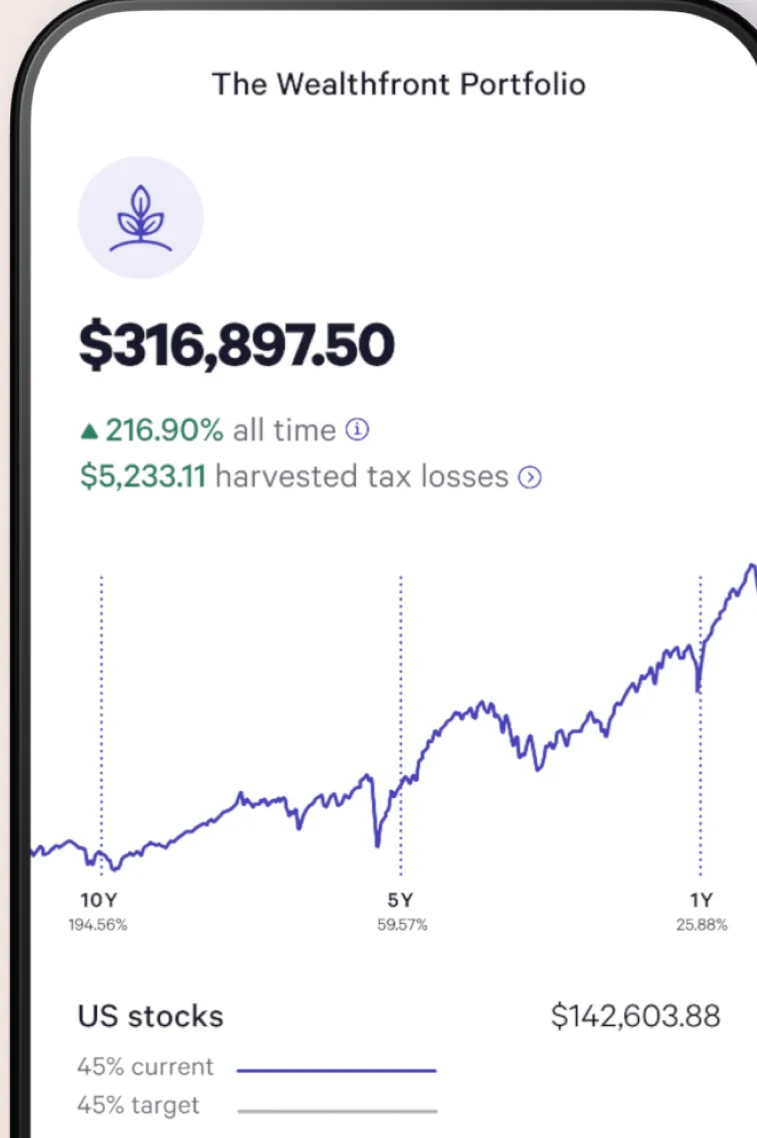
App Store marketing imageThe Wealthfront Portfolio screen showing $316,897.50 with a performance line chart and a US stocks allocation row.App Store listing, as of 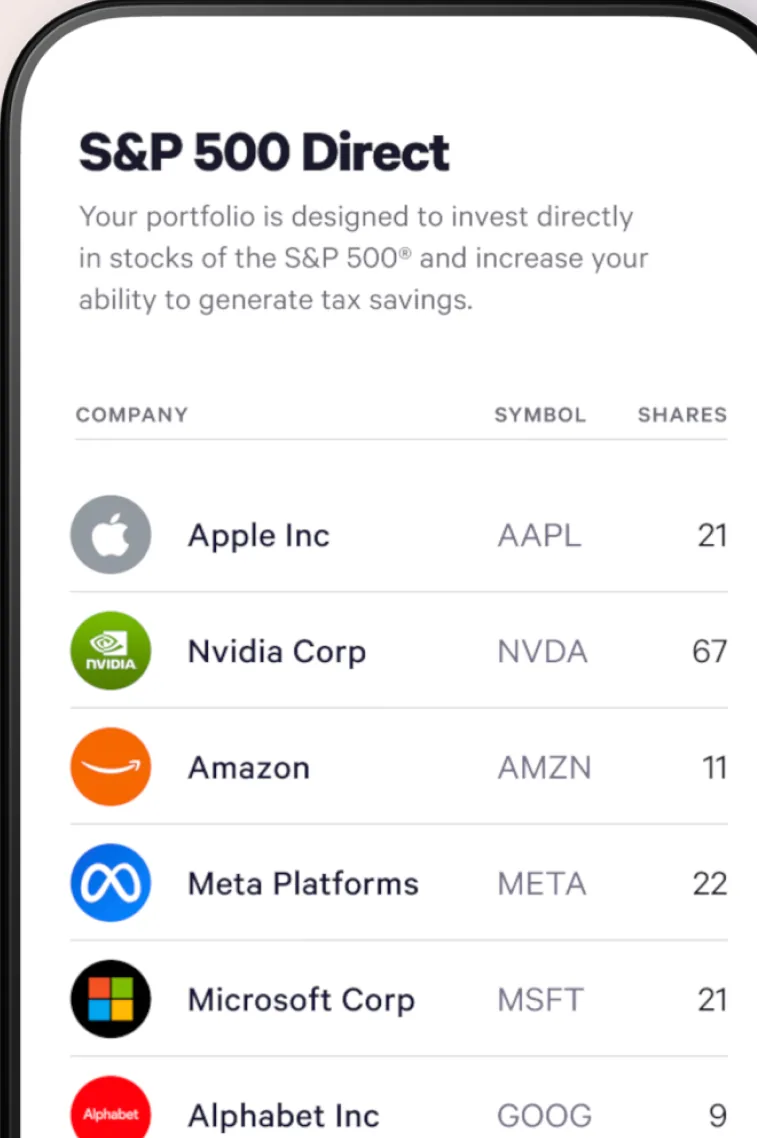
App Store marketing imageAn S&P 500 Direct screen listing individual company holdings such as Apple, Nvidia, Amazon, Meta Platforms, Microsoft and Alphabet with symbols and shares.App Store listing, as of 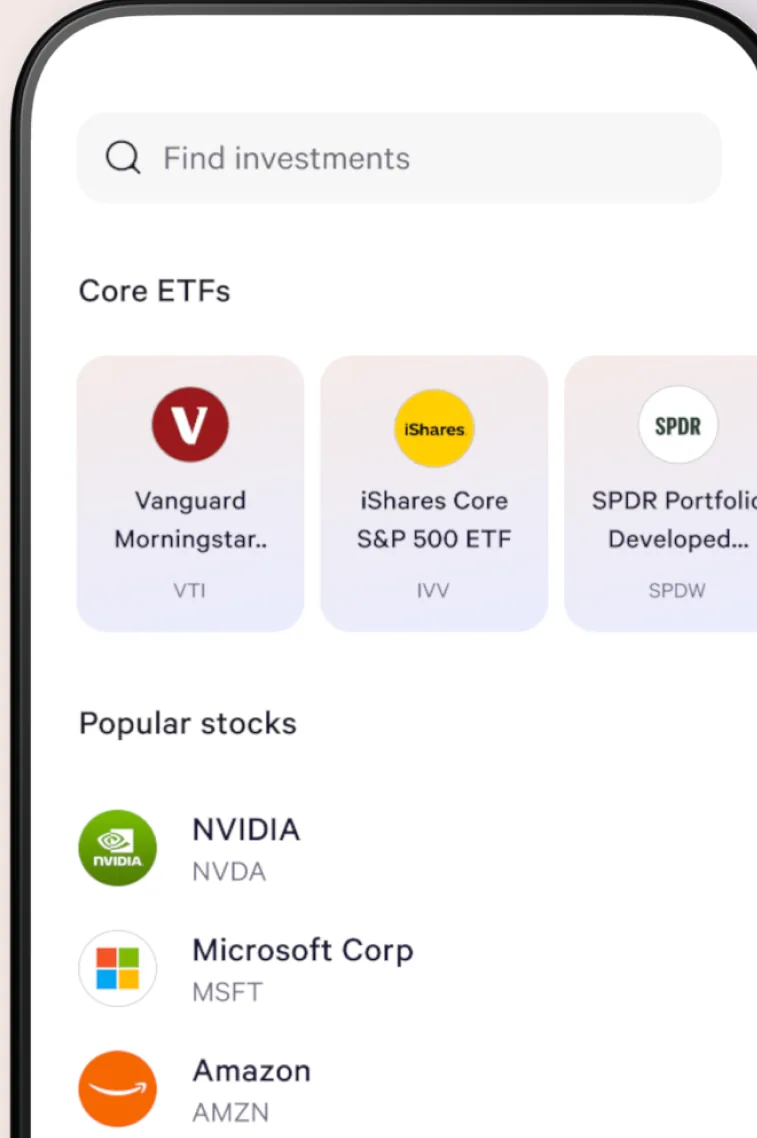
App Store marketing imageA brokerage search screen with a Find investments field, Core ETFs tiles and a Popular stocks list.App Store listing, as of 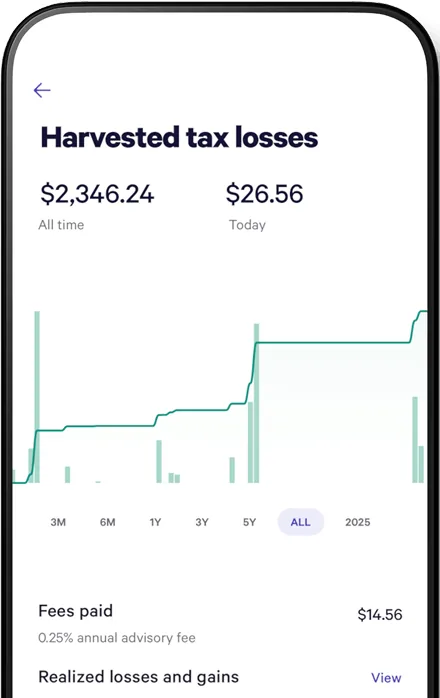
From Wealthfront's websiteA Harvested tax losses screen showing $2,346.24 all time and $26.56 today, a chart with time range buttons, fees paid of $14.56 and a realized losses and gains row.wealthfront.com, as of 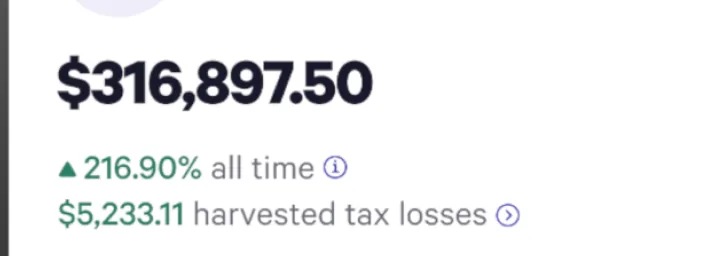
App Store marketing imageA portfolio value of $316,897.50, up 216.90% all time, with $5,233.11 in harvested tax losses.App Store listing, as of 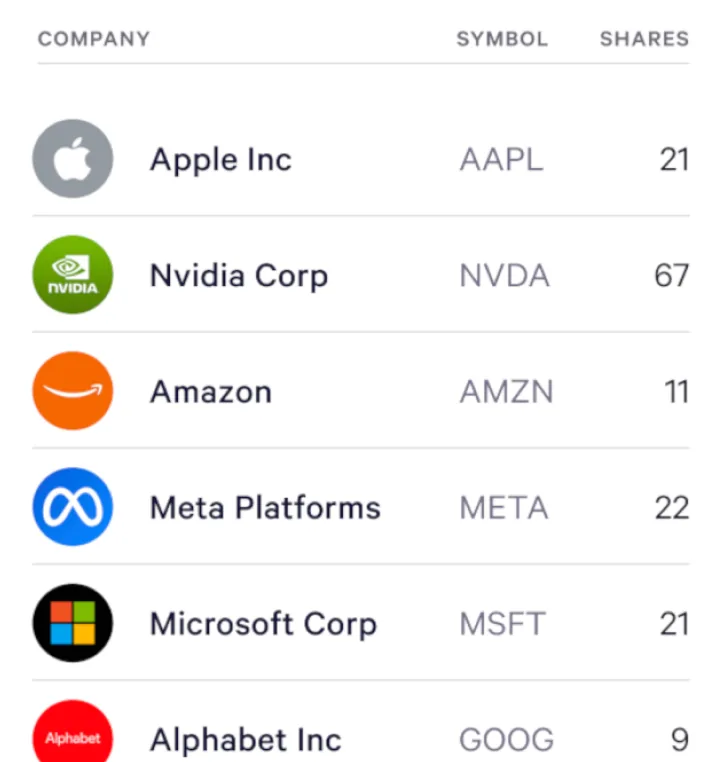
App Store marketing imageA holdings table with company, symbol and shares for Apple, Nvidia, Amazon, Meta Platforms, Microsoft and Alphabet.App Store listing, as of 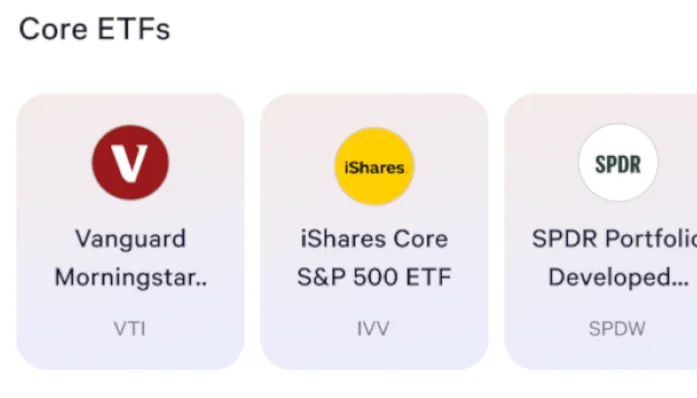
App Store marketing imageCore ETFs tiles for Vanguard, iShares Core S&P 500 ETF and SPDR Portfolio funds.App Store listing, as of

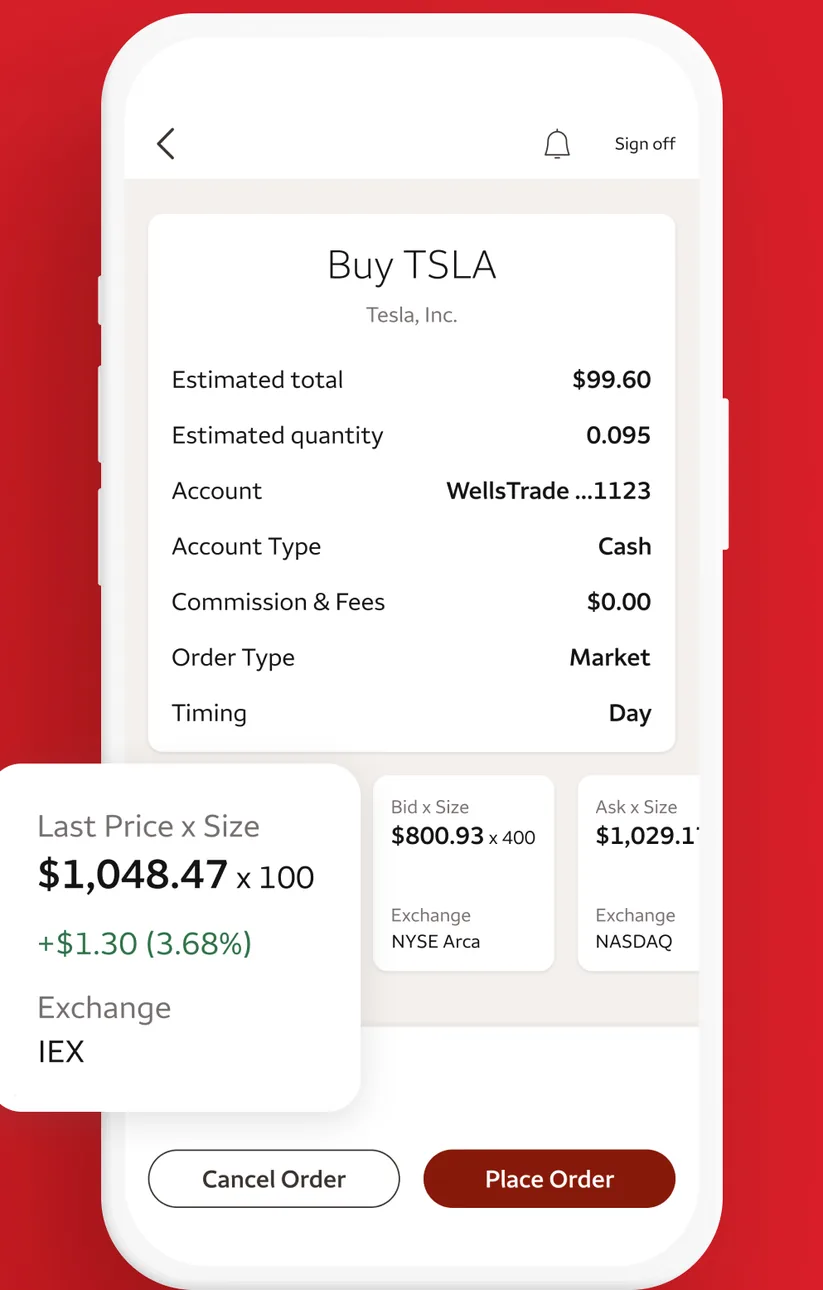
App Store marketing imageA Buy TSLA order screen listing estimated total, quantity, account, order type and timing, with last price details and Cancel Order and Place Order buttons.App Store listing, as of 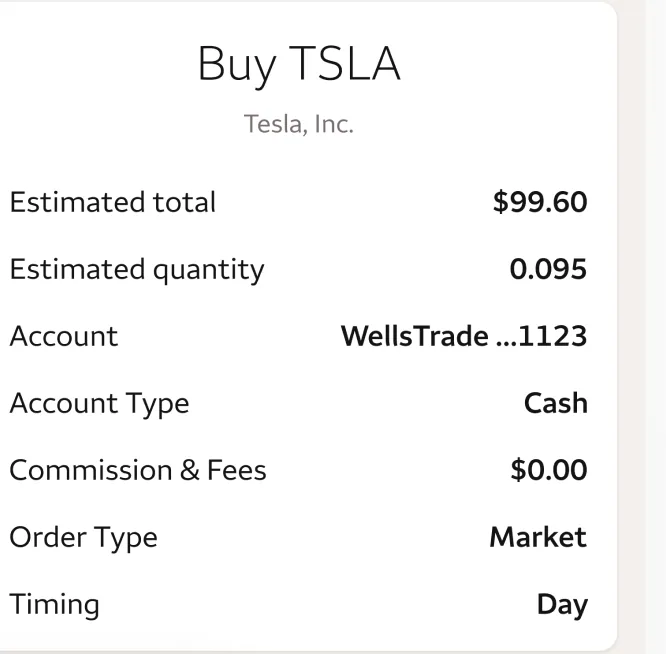
App Store marketing imageAn order summary for buying TSLA with estimated total $99.60, quantity, account, commission and order type.App Store listing, as of
This is education, not financial advice.